MachPro Commands, Function Buttons, and Dashboard
Commands
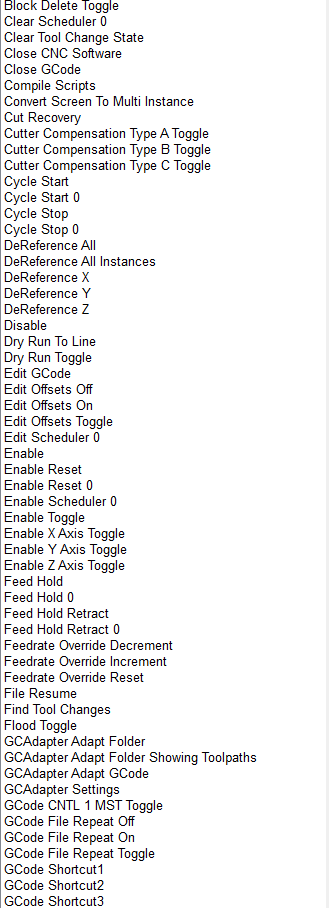
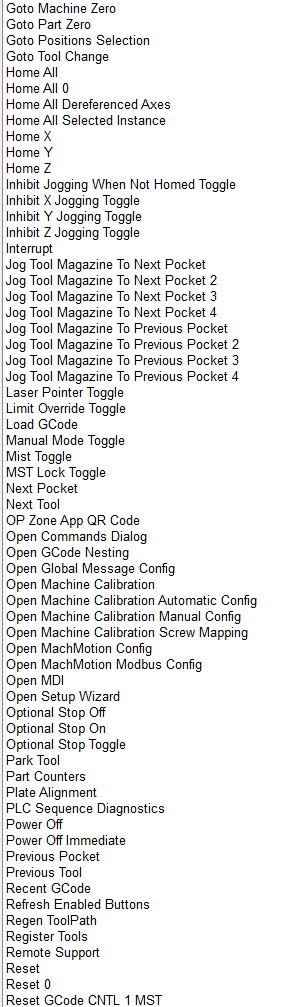
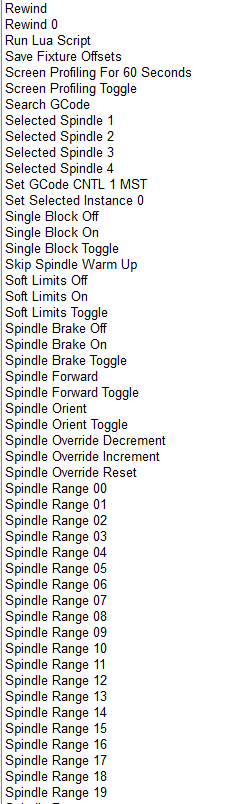
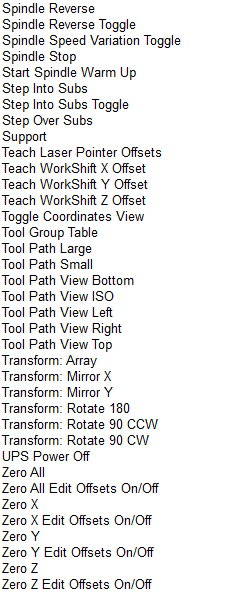
The system has many packaged functions called commands. These commands can perform a variety of actions, such as turning on the spindle or zeroing an axis. All commands have an action associated with them. Some actions also have a feedback associated with them, such as the 'Spindle Forward' command where the feedback is whether the spindle is currently running forward or not.
Commands and User Commands can be assigned to function buttons on the control, in order to customize the experience.
User Commands
Additionally custom commands, called User Commands, can be configured in the 'Screen Configuration' dialog. This is accessible through the 'Screen Config' button on the Service/Maintenance tab.

To make a new User Command, press the 'Add' button. Each User Command should have a unique name. To edit a User Command, select its name from the list. A searchable list of actions for the command is available in the first box. This selects the general type of action to be done. The second box, labeled 'Options', is also part of the action and must be selected.
The 'Feedback Source' and 'Feedback Target' sections are optional. They are relevant if the User Command will be assigned to a function button. Some User Commands won't have a logical feedback source. A reasonable example is for a command that turns soft limits on and off: the feedback would be if soft limits is on or off. The feedback target offers a way to do a simple forwarding of the user command state if desired.

One option for user commands are User Scripts. These are lua functions that will be executed as the command, to get the feedback state, or to forward to the target. This is a way to create completely custom functionality. They should always be done in the UserGUIModule.UserStartUpScript function. The following is an example of how to create these lua function in the UserGUIModule.
function UserGUIModule.UserStartUpScript()
  local action_func = function()
          local state = w.GetSignalState(mc.OSIG_OUTPUT0)
          w.SetSignalState(mc.OSIG_OUTPUT0, not state)
      end
  w.CreateUserCommandActionOption("Toggle Output #0", action_func)

  local feedback_func = function()
          return w.GetSignalState(mc.OSIG_OUTPUT0)
      end
  w.CreateUserCommandFeedbackOption("Output #0", feedback_func)

  return true, true, w.FunctionCompleted()
end
Function Buttons
The MachPro operator panels and wireless pendants have a number of function buttons on them, labelled F1, F2, etc. These buttons initially do nothing, but can have commands or user commands mapped to them. This is done through the MachMotion operator panel configuration.
Upon saving and exiting configuration, these commands will be mapped to the function buttons.

On the screen, there are five function buttons underneath the axis DROs. Instructions on how to configure those buttons, as well as how to add more function buttons to the screen, are in the Dashboard section.
Dashboard
 The MachPro controls have multiple places to customize the interface to meet the users needs. The operator panel has function buttons that can be assigned operations, and there are two dashboards on the screen for the user to place widgets that they want to see. One dashboard is on the far right of the control and is available from all views. The other dashboard available to customize is on the service page.
Dashboards can be configured by right-clicking on them to access their menu. The user can choose how many and which widgets to show on the dashboard, as well as their layout. There is a wide variety of widgets to select from, and some widgets have additional options within them accessible through the 'Configure Widget' menu option.
One particular widget is the 'Function Buttons' widget. It is configurable in a similar way to the overall dashboard, but instead of selecting widgets, the user can select Commands to run on press and release. The user can also set the labels and colors of the button to suit them.

Aside from running Commands, function buttons can be configured to run an MDI command instead. Setting the MDI command to run, either press or release, is accessible through the right-click menu. Those menu options will only be available if the button does not have a Command set for it already. To create a multiline MDI command add a "\n" between the MDI lines.
For example, to run this command:
M6 T1
M3 S1000
You must program it like this: "M6 T1 \n M3 S1000".
|
|
|
|
|
Usually we only configure the button press, but we can also configure the button release function. Functions that toggle have a similar effect to the press and release functions.
Most controls have at least three dashboards on the screen, the first one is under the Axis Positions (Labeled '1' in the example below) referred to as the Axis Positions Dashboard, and the second on the right side of the screen referred to as the Side Bar Dashboard (Labeled '2' in the example below). The third dashboard is on the Service page.

Axis Positions Dashboard
The Axis Position Dashboard is locked to only allow the Function Button widget with 5 configurable buttons. These buttons configurable in the same manner as the function button widget on the Side Bar Dashboard, through the right-click menu.
Side Bar Dashboard
On the right side of the screen is a large Dashboard with lots of space to add Widgets that will improve productivity. Configure the dashboard through the right-click menu.
Widgets
Widgets are small components that can be added to the dashboards to show data like the last probe position or to add buttons for controlling a chip conveyor. To see the list of available widgets right-click on the edge of a dashboard and select the drop down list.
Many widgets have additional options to configure the way they look or which variables are shown in the widget. So see a list of options right-click inside the widget and select from the menu. The menu is context sensitive and some widgets have additional options, but these three options are always available.
If "Set Variable Format String" is an option, right-click on the row you want to change and select "Set Variable Format String." Then enter a string format with the following syntax: %.Xf (where the X represents how many decimal places. For example, if you only want 1 decimal place, enter %.1f. This will display a value 170.2353 as 170.2. You have to re-enter the value on the screen for it to display with the new format. Search for external documentation on operator (c-style string formatting) syntax for a complete list of options.
|
Right click directly on an entry. |
Use compact display or specify height of the rows. The default is 22.
|
Select Get Info about the entry you right clicked
|


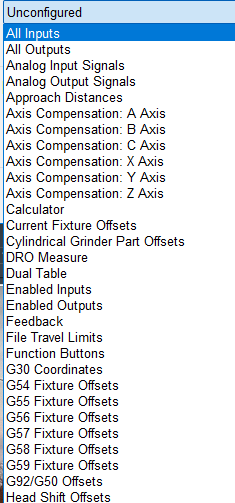
All Inputs and All Outputs
These are two separate widgets, one for inputs and one for outputs. They have the same function. They may be useful for troubleshooting during installation, and it will display all the inputs or outputs (including ones not enabled or used) in a scroll-able window. Alternately, to just see particular I/O information, use these widgets:
- Enabled Inputs and Outputs are at the hardware level
- Signals are at the software level and are mapped to particular hardware inputs and outputs
|
If you add a description to an input in the Controls Inputs tab, that description will be used here.
Note the scrollbar on the right side. All inputs are visible when you scroll. |
If you right click and select Run Test Sequence, you will see this popup. There are a large number of inputs and running the sequence 10 times will take some time.
|


Analog Input and Output Signals
These are two separate widgets and each allows you to add specific input and output signals to your dashboard.
|
To add Analog signals, right click in the widget and select Add Variables.
|
Right click in the widget or directly on one of the signals.
|


*Approach Distances
All axes will use this value when doing a probe move for both edges and corners. It is the maximum distance the probe will move while searching for material. If the probe is not activated before this distance is consumed, then an error will occur and the operation will be stopped.
|
|
The Approach Distances feature is used on the fixtures tab with edge finding. |

*Axis Compensation
|
|
This is used on grinders to adjust for the grind wheel size changing during dressing or grind cycles. Grinder controls will have these functions configured in their profile, and you will not normally need to add this widget. |

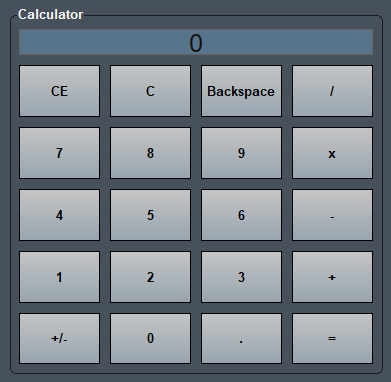
Calculator
|
|
This is a simple calculator that is useful if you often need one while working on the control. There are no special features to configure here. If you need a calculator with more advanced features, the Windows calculator is available. |
Current Fixture Offsets
This displays the current offset of each axis from the machine zero location on that axis. It is the same as the opening the Fixtures Offsets table on the Fixtures tab. This is a display widget. If you want to change these values, open the Fixture Offsets table on the fixtures tab.
|
|
|


*Cylindrical Grinder Part Offsets
The part offset table (Part Correction Offset) which, when multiple features are being ground on the part, can be used in conjunction with an "E" variable in the program to allow adjustments to each feature individually. This widget is normally part of the grinder profile and should not need to be manually added.

DRO Measure
|
|
This provides a digital "tape measure" that can measure axis movement, and be reset at will. It does not change any operating values or parameters. |

Dual Table
|
|
This widget is used on routers with two tables. Setup and use is documented in the 2000 Series Dual Table article. |

Enabled Inputs and Outputs
|
|
These widgets will show only the inputs or outputs that been enabled. Right clicking on the display will bring up a menu. If you click on a particular input or output, you can get information about that entry. |

Feedback
|
|
This provides an on-screen indicator when any of the axes are moving. |
|
|
Right click on the border space around the buttons and select Configure Widget to access the display options.
The Grid Configuration you select determines how many rows and columns of axis indicators you will have. |


*File Travel Limits
|
|
This displays the extents of movement you will have on each axis for the file that is loaded. Using this along with the yellow soft limit display on the tool path will help you identify fixture problems before you run a file. |

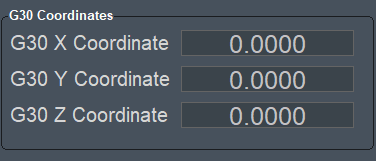
*G30 Coordinates
|
|
This is similar to the G28 command. G28 ends at machine zero while G30 allows you to specify a different end coordinates than machine zero. |
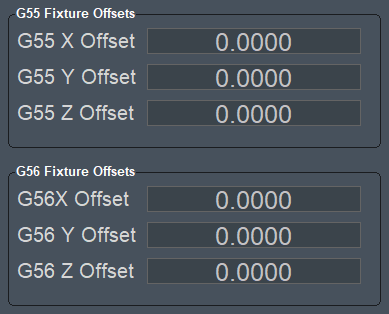
G54 - G59 fixture Offsets
This widget displays the current values of your offsets. These coordinates are always the distances from machine zero on each axis. You may add a widget for each set of offsets that you want to monitor. This is a display widget. If you want to change these values, open the Fixture Offsets table on the fixtures tab. If you want a single widget that dynamically updates to show the current offsets, use the Current Fixture Offsets (above).
|
Standard display
|
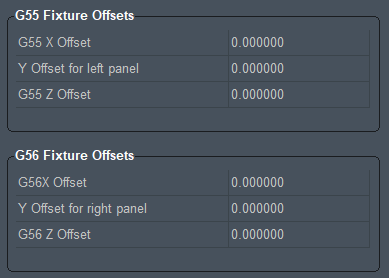
Compact Display with Y offset labels customized
|
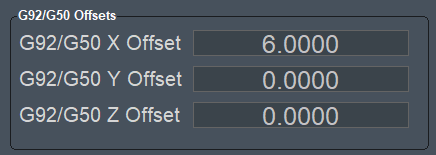
*G92/G50 Offsets
Use G54–G59 fixture offsets or GOTO positions instead of G92 and G50/G52, which were used before fixture offsets existed. Try these features first. You may also use the Head Shift Offset and Work Shift Offset widgets to make adjustments directly on the screen - without any G-Code changes.
|
The widget will display any offsets created with G92 or G52 in your G-Code.
|
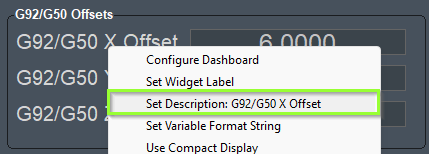
You may also change the labels of the offsets to match your naming convention.
|
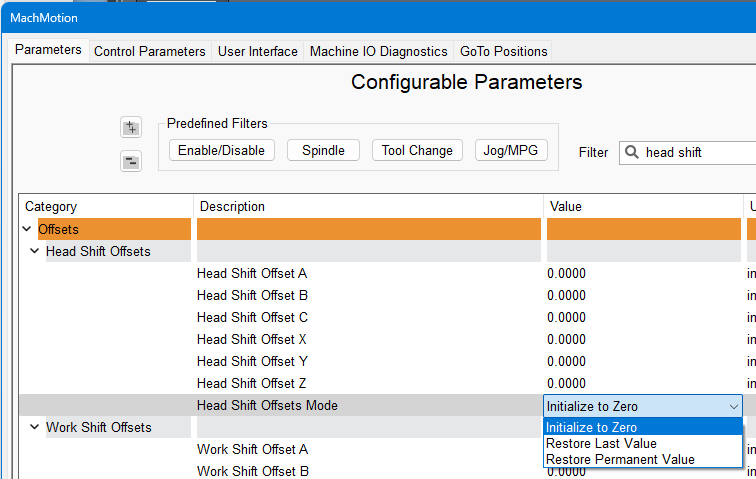
Head Shift Offsets
Head Shift and Work Shift offsets are very similar. Head shift is typically used for permanent offsets related to multiple heads - such as a router with a standard spindle, and a drill bank, or an engraving laser. You need to shift your your cut path to use the other tool while maintaining the same fixture coordinates.
The values entered in the on-screen widget update the fixture table.
|
|
|


The head shift values will reset to zero when you restart the software. If you want to set permanent values in the head shifts, you can change that option in the MachMotion Plugin. You can restore the last value you entered, or you can enter a permanent value to be restored each time the software starts.
Head shift values will not change the standard G54-G59 work offsets, but they do stack on top of those values. You can also have both head shift and work shift values in effect at the same time. The head and work shift values will apply to your current work offsets.
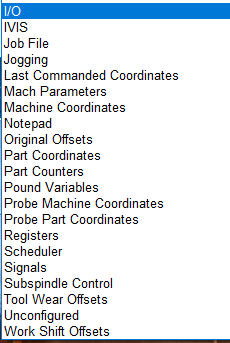
I/O
This shows the status for most of the system, but it is not intended for changing values. It is primarily used for system customization.
These examples show how the I/O indicators change when the Goto and MDI features are used. Many more in-depth optionsThere are available,sub-menus under each category, and all of the current optionsthey are shown below.
|
|
|
|


|
|
|
|
||
|
|
|
|
||
|
|
|
|


IVIS
This is the interface for a software tool used on some grinders. If your system uses IVIS, we will configure this widget for you.
Job File
This widget is used in custom profiles. Please contact MachMotion for configuration.
Jogging
This widget provides both on-screen and keyboard jogging. There are different on-screen axis button configurations to better match your system.
|
|
|
|
|
|
|
Lite is used to select the axis on computers that have + and - jog buttons on the panel. |
|

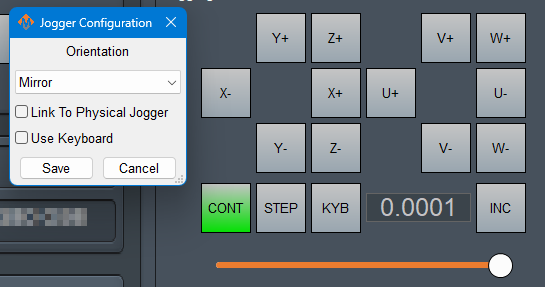


- CONT is continuous movement as long as you press the relevant axis button.
- STEP moves the axis by one increment with each press of the axis button.
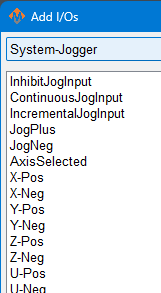
- KYB uses keyboard mappings to control different aspects of the jogging function. Select the functions you want to use in the Jogger Configuration window, then map the key combinations in the Keyboard Inputs plugin.
- INC cycles through the jogging distance increments: 0.0001, 0.001, 0.01, 0.1, 1.0
The Jogger Configuration option to link to the physical jogger, allows you to keep the feedrate value synced with other physical pendants.
This is the feedrate slider

|
|
|

Last Commanded Coordinates

This reports the last position that each axis has been commanded, either by the G-Code file or by MDI.
G0 X1 Y1 Z1
G0 X2 Y2
These G-Codes above resulted in this display. If an axis is not commanded for multiple blocks of code, it will retain the last commanded coordinate.
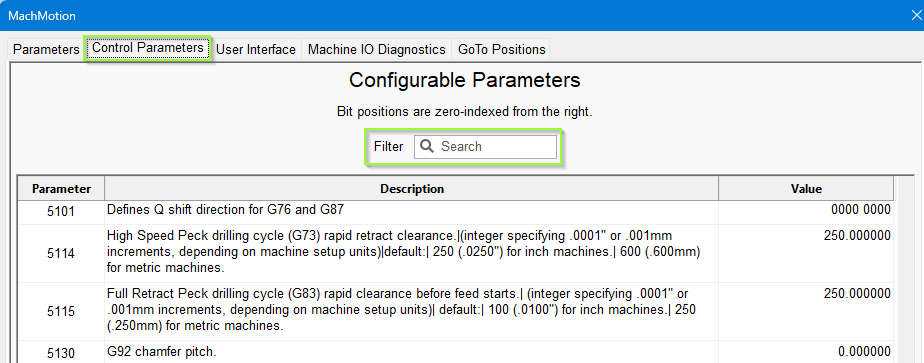
Mach Parameters
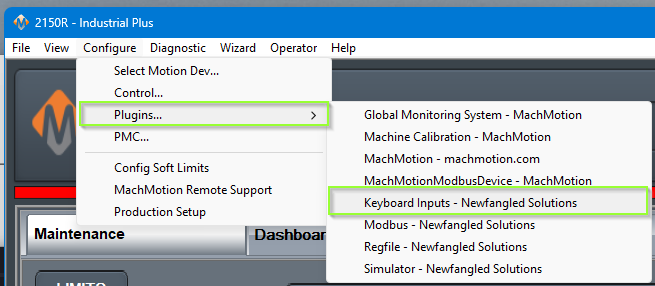
These are the values stored in profile\parameters.ini and are best accessed in the MachMotion Plugin. Pull down the Configure menu | Plugins -> MachMotion parameters. Normally you will not need to monitor or change these values. This widget is primarily used for system customization.
|
|
|


Right-click in the widget to bring up the menu. This menu is specific to #5130 because I right-clicked that entry.
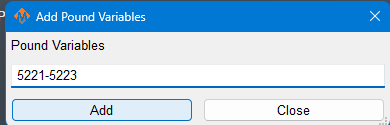
To add variables, select Configure Widget, fill in the parameters you want displayed, and click Add. You may do this repeatedly. The Add window only closes when you click Close.
Using the right-click menu you may remove individual variables, or all of them.
Machine Coordinates
These are the distances from the machine zero on each axis. You can toggle the DRO to show View Machine, and you can use this widget to display machine values at all times. See also Part Coordinates.
|
|
|


Notepad
This is a simple notepad that retains the text even when the control is fully power cycled. Right-clicking will display the options.

Original Offsets
Please refer to, and use, the Current Fixture Offset widget
Pound Variables
The system variables, or pound variables (# variables) are documented in the Macro B Reference Guide in the System Variables section. They are shared memory between G-Code files, and M-Codes and plugins.
|
From the Macro B section 3.6 System Variables
|
Setting the widget values
|


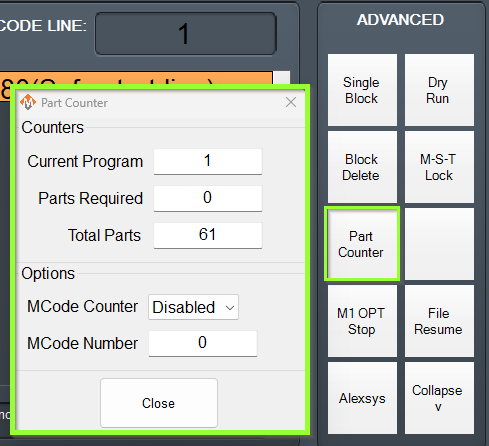
Part Counters
This widget is incorporated into the standard interface, on the GCode tab, and it is best used there.
|
|
|

Part Counters (internal documentation)
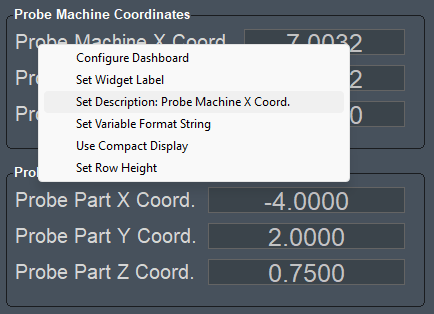
Probe Machine Coordinates and Part Coordinates
|
|
|

Registers
Signals
Part Coordinates
Work Shift Offsets
Work Shifts and Head Shifts are very similar. Read the Head Shift documentation as both type of offsets are configured and modified the same way.
Work shifts are typically used for temporary changes. Your stock may have a defect and you need to shift your fixture coordinates by 0.005 inches for this piece. This widget provides an easy way to make those kind of temporary adjustments quickly, without changing your existing fixture offsets. When you are done with this piece you can reset the work offsets to 0.0000 and use unmodified fixture offsets.
Widget Customization
Lets test and customize the Pound Variable widget to learn more about its features. First right click on the Side Bar Dashboard and select the Pound
Pound Variables
In this example we are going to add variables to the Pound Variables widget. Right click with your mouse inside the Pound Variables widget and select Configure Widget.

Now from this window we can enter the range of variables we want to view and the press Add. I entered 500-510.

Now we have the widget showing the values from the variables.

Next lets rename one of the variables with a name to make it easier to remember. Right-click on the row labeled #501 and select Set Description: #501.

Enter the name Part Width and press OK.

Now we have a widget customized with a description for variable #501.

You can also set how many decimal places for pound variables. Again, right-click on the row you want to change and select "Set Variable Format String." Then enter a string format with the following syntax: %.Xf (where the X represents how many decimal places. For example, if you only want 1 decimal place, enter %.1f. This will display a value 170.2353 as 170.2. You have to re-enter the value on the screen for it to display with the new format.